Our improved analytics shows high variability in Chicago building & construction activity
Member only content
Published on Feb. 1, 2026 by Steven Vance
We’ve added or improved three analytics features in our Chicago building permit statistics webpage to provide deeper insights into and visualizations of Chicago’s construction activity.

Interactive chart showing processing times
Visualize building permit processing times — measuring the duration from application to issuance — in a new rolling average chart. It shows separate trend lines for new construction permits, renovation/alteration permits, and a combined average. Adjust the moving average period — 7, 14, 30, 60, or 90 days — to smooth out daily fluctuations and spot longer-term trends.

Lower values mean faster permit issuance; processing time includes time spent with city reviewers and with the applicant responding to comments received during the review.
One pattern I’ve noticed is that the rolling average processing time (measured in days) for Standard Plan Review is highly variable for new construction permits, and has ranged from over 200 to fewer than 50 days. The chart also has a filter to analyze permits processed via the self-cert and Direct Developer Services programs, as well as a combined view of all three review programs.
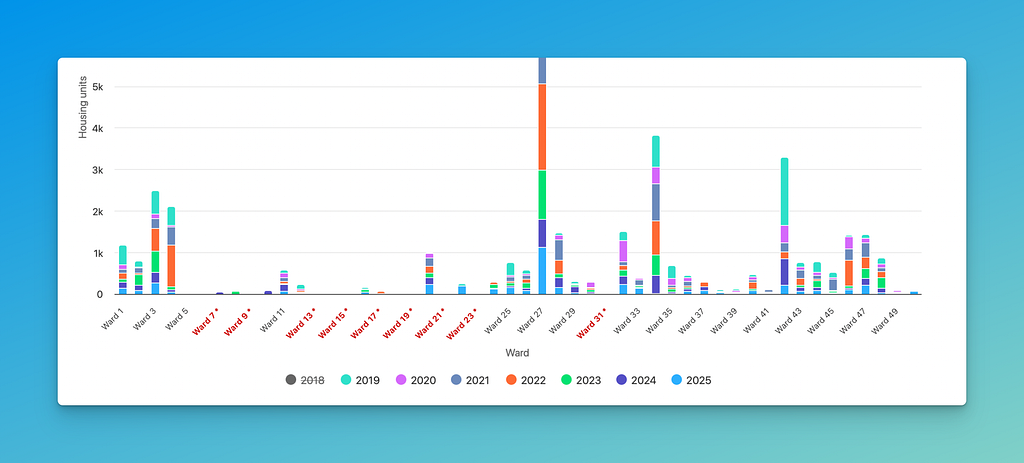
New construction housing units by ward
A new stacked column chart displays housing units from new construction permits by ward over the past eight years (2018-2025). This visualization makes it easy to compare development activity across Chicago’s 50 wards and see how construction has shifted over time. Wards with fewer than 100 total units are marked with an asterisk. The accompanying data table includes unit counts that have been audited for accuracy from 2019 through 2025.
Fee payment status of issued permits
Ever wonder how many issued permits have unpaid fees? Our new fee payment status table breaks down permits issued in the last year by type, showing how many have all fees paid versus those with outstanding balances. This information is also available for individual Chicago building permits selected in Building...
Tags
Click a tag to find more posts.
- analytics (1)
- feature_announcement (6)
Other posts by Steven Vance full archive
March 2026
February 2026
- Our improved analytics shows high variability in Chicago building & construction activity
📄 you're reading this one