The federal reserve bank of St. Louis has an interactive economic data portal called FRED.
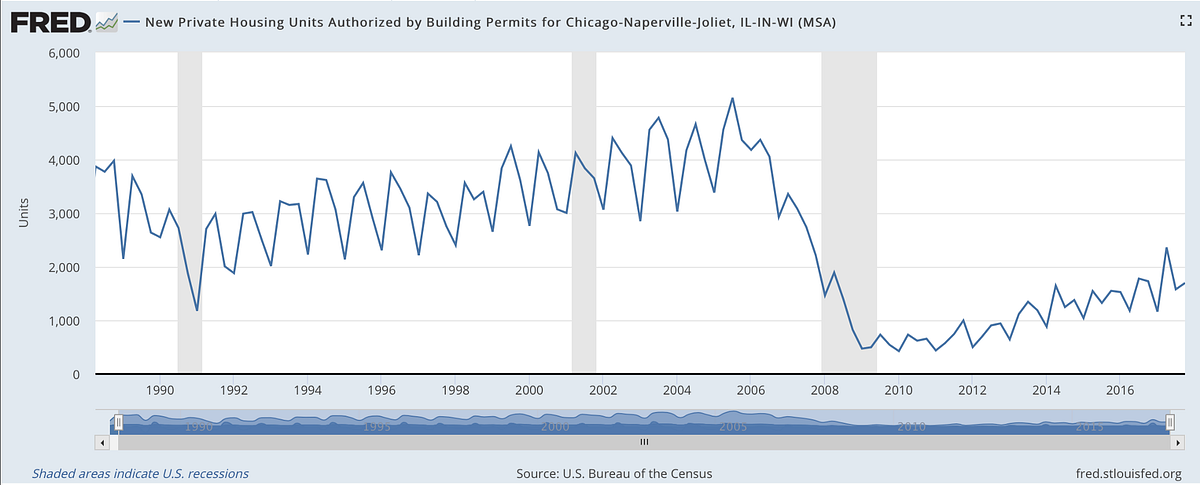
The chart above shows the quarterly average of new construction housing units (excluding public housing) in “Chicagoland”. I switched it from monthly unit count to the quarterly average to lessen the number of peaks shown in the graph. The data is not seasonally adjusted, and it doesn’t look like FRED can automatically adjust the data for seasonality.

The actual region measured is the Chicago-Naperville-Elgin Metropolitan Statistical Area, which is an enormous area covering the City of Chicago, all of its suburbs, and then some exurbs like DeKalb, Illinois, and what I would tenuously call suburbs in Southeastern Wisconsin and Northwestern Indiana.