We’ve summarized 10 of the biggest changes here
Today we launched the biggest group of style and user experience changes in one go. You’ll see the changes across the site. We’ve also new data download features for Cityscape Pro members based on their feedback.
“Everywhere” changes

We’ve adopted a new map style from CARTO — it has more intuitive colors than our previous blue and gray hues that makes it easy to see parks and major streets while buildings now have a 3D effect and address numbers for easy location identification.
If you see errors on our maps, please let us know.
Another “everywhere” feature: Download all datasets as KML (look for the button below every data table) that you can quickly import into Google Earth and Google My Maps. You’ll find this button across building permits, violations, zoning changes, TIF-funded projects, Cook County Land Bank Authority properties, and more. This is in addition to the buttons to “Copy to clipboard”, “Export as CSV for Excel”, and “Download as GeoJSON” (for GIS users).
Look for pan-Chicago statistics on the homepage
In addition to the daily stats that have been on the homepage for a long time, we’ve listed the top general contractors, architects, and property owners, based on the number of permits they’ve pulled in the last three months.

We’ve also added a colorful line chart that shows new construction and renovation permit activity across all 77 community areas in Chicago. The chart initially shows only those that are in the 90th percentile in the most recent 90-day period; you can click on other community areas to see how they rank against the top 10 percent.
Changes to Maps Explorer
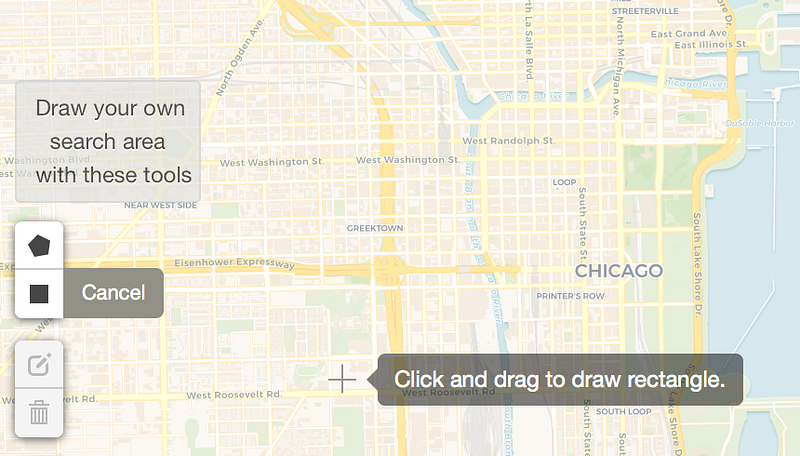
Search our database of over 22,200 maps simply by drawing a box around your interest area — go to Maps Explorer, click on the “square” drawing tool under the label “Draw your own search area with these tools”, and draw a box on the map. After a few seconds, the map will show all of the different maps that we have that intersect the box you drew.
Let’s say you’re interested in all the different maps that O’Hare airport can fit into. Draw a box or polygon around the field and you’ll get 86 results back. (The airport is a big place and we have a lot of maps.) It intersects with several county and state elected districts, police beats, and ZIP codes.
And, you can download the resulting maps as a KML file for Google Earth and GeoJSON for GIS applications.
On our 22,200+ Place pages

Place boundaries — all 22,201 of them — are now downloadable in two new formats: KML, for use in Google Earth and Google My Maps, and in SVG, for use in vector illustration programs like Inkscape and Adobe Illustrator. All users can download SVG but only Cityscape Pro members can download them as KML. The GeoJSON format for GIS users remains.

All 6,400 Places in Chicago now have a new statistics section showing the top general contractors, property owners, and architects (just like the homepage) in that Place.
Additionally, the stats show the permitting activity in the last 90 days compared to the previous 90-days period, for new construction, renovation, and easy permit process permits.
Find your Place on Maps Explorer or draw a Personal Place.
Chicago zoning map changes
We’ve added a map legend that shows the zoning map symbology we’ve borrowed from Second City Zoning. This will appear when you click the “Show zoning” button below Place maps, in Address Snapshot reports, and when you access Zoning Assessments.
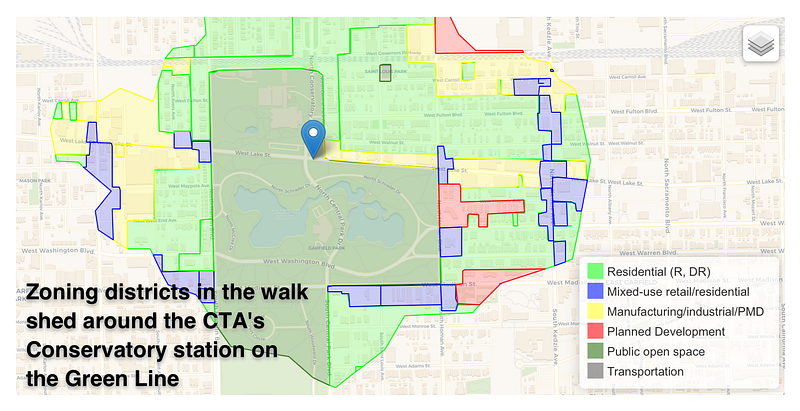
Easily access all Zoning Assessments, including the walk shed assessments around CTA and Metra stations, from the main Zoning Assessment page, from Maps Explorer, or any of the 6,400 Place pages in Chicago. You can download the Zoning Assessment maps as KML or GeoJSON.
What new maps, data, and features do you want to see?
Write a response below.