Determine how much is residential or mixed-use
Zoning Assessment is a new, automated tool that measures the kind of different zoning districts in any of the more than 6,000 maps of Chicago on Chicago Cityscape. With it you can see how much residential-only, mixed-use, or planned developments make up a ward, community, or the area around a CTA station.
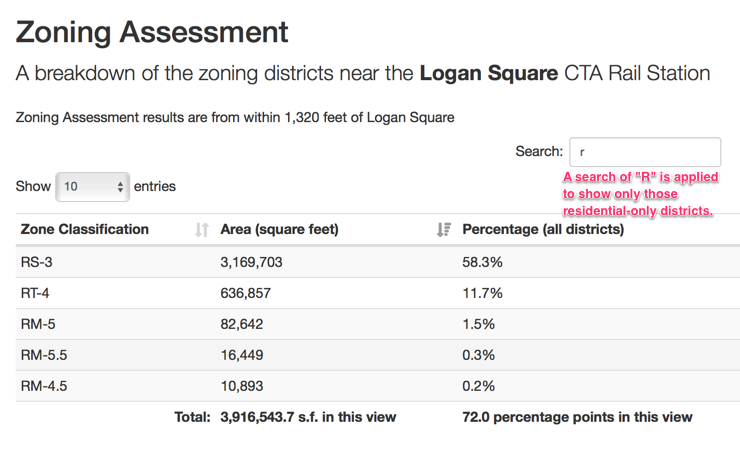
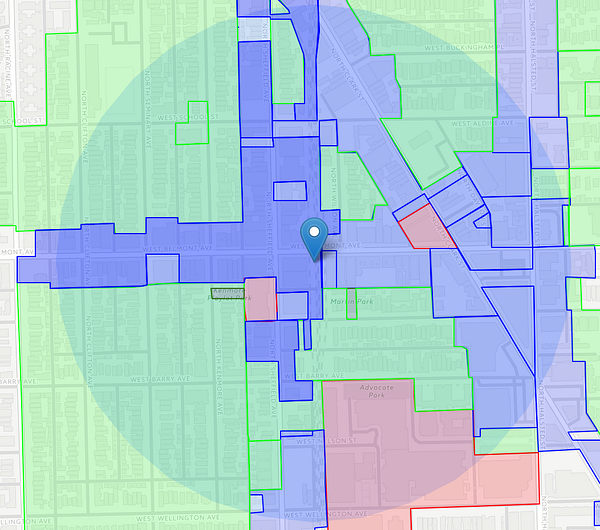
For example, 58 percent of the land within a two-block radius of the Chicago Transit Authority’s Logan Square Blue Line station is zoned to only allow single-family houses. Fully 72 percent of the land area is zoned for residential-only.
That contrasts to the 13 percent of the land around the Belmont station in Lake View that serves the Red, Brown, and Purple Lines, that allows only single-family houses. Forty-two percent of the land area is zoned for residential-only.
Both have 24-hour rapid transit service.

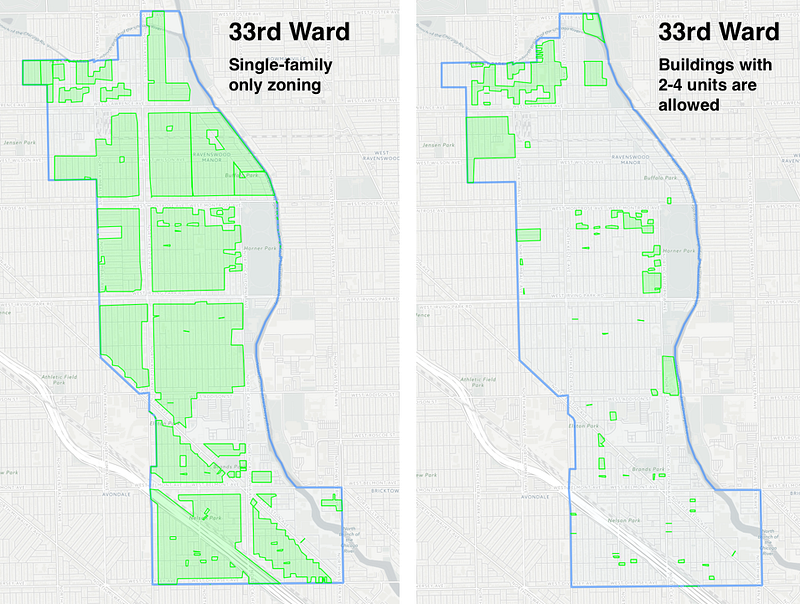
Each has a similar amount of land already zoned to allow 3-flats (and sometimes 4-flats, depending on the lot size), but the Belmont station area has eight times more land zoned to allow buildings with up to a couple of dozen apartments or condos (again, depending on the lot size).
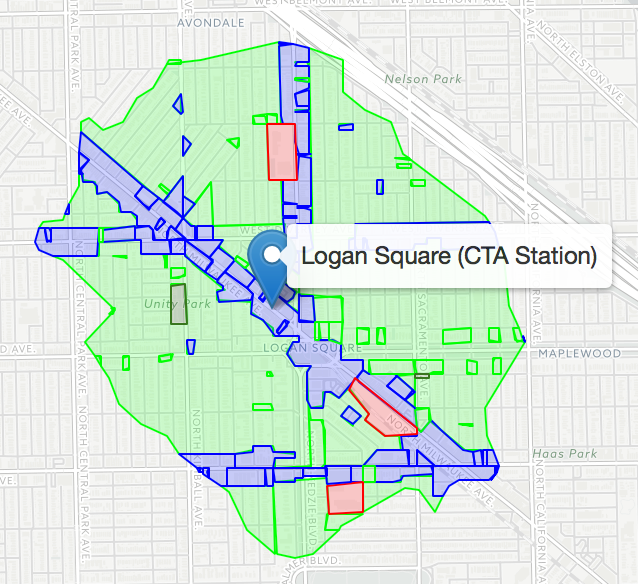
Drawing a two-block radius circle around the station is one thing, but what is the zoning like within walking distance to the station? We’ve since added a “walk shed” add-on, which is described in technical detail. But you can try it yourself here, by clicking on one of the walk shed or bike shed links below the map.
I must always note in these limited zoning analyses that zoning districts are a poor indicator of current — actual — land use. But current zoning has impacts on generating new housing, generating new affordable housing, and zoning can affect construction costs, because of the time and money-consuming process to change zoning in order to build something that isn’t allowed.
In Logan Square, for example, many blocks that are zoned RS-3 (which allows only single-family houses, and two-flats under extreme circumstances) have a majority of two- and three-flats!
One more thing
The Zoning Assessment tool also has a map that responds in real time to your search for specific zoning categories (try “residential”, “planned development”, or “mixed use”).
Can I get the data?
Pro members can download the Zoning Assessment results as KML (for Google Earth and Google My Maps) and GeoJSON (for ArcGIS and QGIS). Not a member? Start a free trial.