I’m not stretching the truth when I tell potential members of Chicago Cityscape that half of our features are because of requests previous ones have made.
This week we added new Census demographic data to each of our 2,600+ Place pages so someone — who contacted us via Twitter– could have more information about their community.
So we added Table B25115, Tenure by Household Type and Presence and Age of Own Children. It tells you about family composition, and broken down by renter and owner-occupied households.
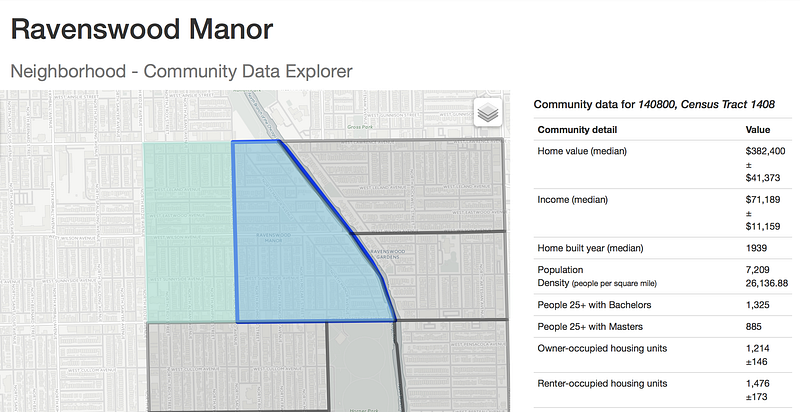
Access this and other Census data by finding a Place page — these are neighborhoods, wards, police districts, and more. Then click the “Show community data” button next to the map. Gray layers will appear on the map; these are Census tracts, and they cross neighborhood boundaries, but they don’t cross natural features.
Click on any of the Census tracts to see selected details about that community. Our favorite is the number of renter and owner-occupied housing, because bias against renters has appeared in local media this year and last and part of that is a misunderstanding of how many people rent in a neighborhood, and a belief that they’re poor and don’t care about a neighborhood’s outcome.