It’s true when I say to people that a majority of the new features we implement on Chicago Cityscape are the result of talking to people who use the website.
This week we added data about the number of families in a neighborhood, due to a request from someone who contacted us via Twitter. (Every time someone new follows @ChicagoCityscape, we send them a tweet asking if they have any particular data needs.) They wanted to know the breakdown of children living in renting and owner-occupied households.
And table B25115, also known as “Tenure by Household Type and Presence and Age of Own Children”, has information about whether renting households or owner-occupied households in a place have more children living at home.
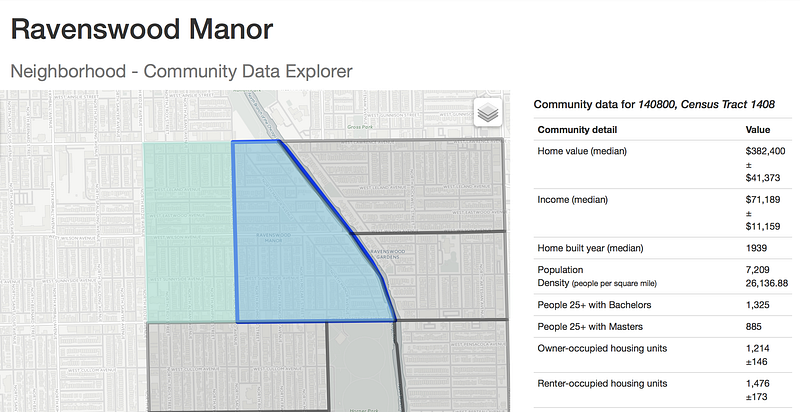
Access this information on Cityscape by going to any Place page and clicking the “Show community data” next to the (now wider) map. A map of Census tracts will be overlaid on the map. Click any of these tracts to bring up a table of demographic data about that part of a neighborhood.
This data is updated annually, as part of the Census Bureau’s American Community Survey. Generally, their five-year estimate provides as much data about a neighborhood as the decennial census does.
The wonderful U.S. Census Bureau provides all of its data via API, and we can easily access that through their CitySDK software package for JavaScript.