What does the 2020 Census data tell us about Chicago and Chicagoans?
Published on Aug. 24, 2021 by Steven Vance
Updated on Aug. 25, 2021
We’ve compiled perspectives and data resources about the new Census data that explains what happened to Chicago’s population (it went up). But first I’ll explain some basics about the data source.
Every 10 years, the United States counts everyone in the country, called the decennial census, and is required by the U.S. Constitution. These counts inform redistricting, where the boundaries of elected representatives can be drawn because Congressional and other political districts — including Chicago’s wards — must have a nearly equal number of people in them.

The U.S. Census Bureau conducted the count last year. In April, the bureau published “apportionment” data that says how many Congresspersons each state will have (Illinois will lose one Congressional seat; see the other states).
The most recent release, of decennial census data, on August 12, 2021, is what has been in the news this month; it’s the first dataset that includes information at the city level. The Illinois General Assembly used less accurate American Community Survey (ACS) data to redistrict the Illinois legislature and Cook County Board of Review boundaries. We explained these new state boundaries and added them to our map in June.
The Daily Line compared the ACS and decennial census data and found “wide deviation”: “The ACS data undercounted the state by 41,877 residents”, to give one example. Cook County was among 29 counties that were undercounted. To deal with this, Illinois legislature leaders scheduled a one-day special session on Friday, August 31.
What is Chicago’s population now?
Chicago’s population in 2010 was 2,695,598 and in 2020 was 2,746,388, an increase of 1.9 percent. The intervening population estimates — which showed “worrying” declines — were off, as explained in this Crain’s article.
Which demographic groups grew and shrunk?
The following analysis was done by demographer Frank Calebrese. Note that the Census form allows people to pick multiple races and combine it with an ethnicity of Hispanic or Latino. The categories below that are not “other” should be read as people choosing solely that race or ethnicity and not a combination; this is sometimes written as “[category] alone”.
- Latino: up 5.22 percent
778,862 to 819,518 (40,656 more people) — now the second largest race or ethnicity category in Chicago, after White - Black: down 9.71 percent
872,286 to 787,551 (84,735 fewer people) - White: up 1.04 percent
854,717 to 863,622 (8,905 more people) - Asian: up 31.02 percent
144,903 to 189,857 (44,954 more people) - Other: up 91.48 percent
44,830 to 85,840 (41,010 more people)— there is an increase of people not identifying by race, which Frank highlighted and on which Bread Price Fixer opined while the Census Bureau explained a difference in how it collected this attribute.
Which areas of Chicago grew and shrunk?
Downtown Chicago and the South Loop grew the most. More specifically, “Since 1990, the population of the Loop and its 3 adjacent community areas has nearly doubled, and the last decade saw the largest growth yet, both in raw and percentage terms,” (Bread Price Fixer, an anonymous Chicago-based data engineer).
The five community areas with the next highest growth were (click on any community area link to open its Place Snapshot and map):
- Oakland (14.9 percent or 881 people; Oakland makes up part of the Bronzeville neighborhood)
- Hyde Park: 14.7 percent or 3,775 people)
- Grand Boulevard: 12.1 percent or 2,660 people; Grand Boulevard makes up part of the Bronzeville neighborhood)
- Riverdale (12.0 percent or 780 people)
- Douglas (11.3 percent or 2,053 people; Douglas makes up part of the Bronzeville neighborhood)
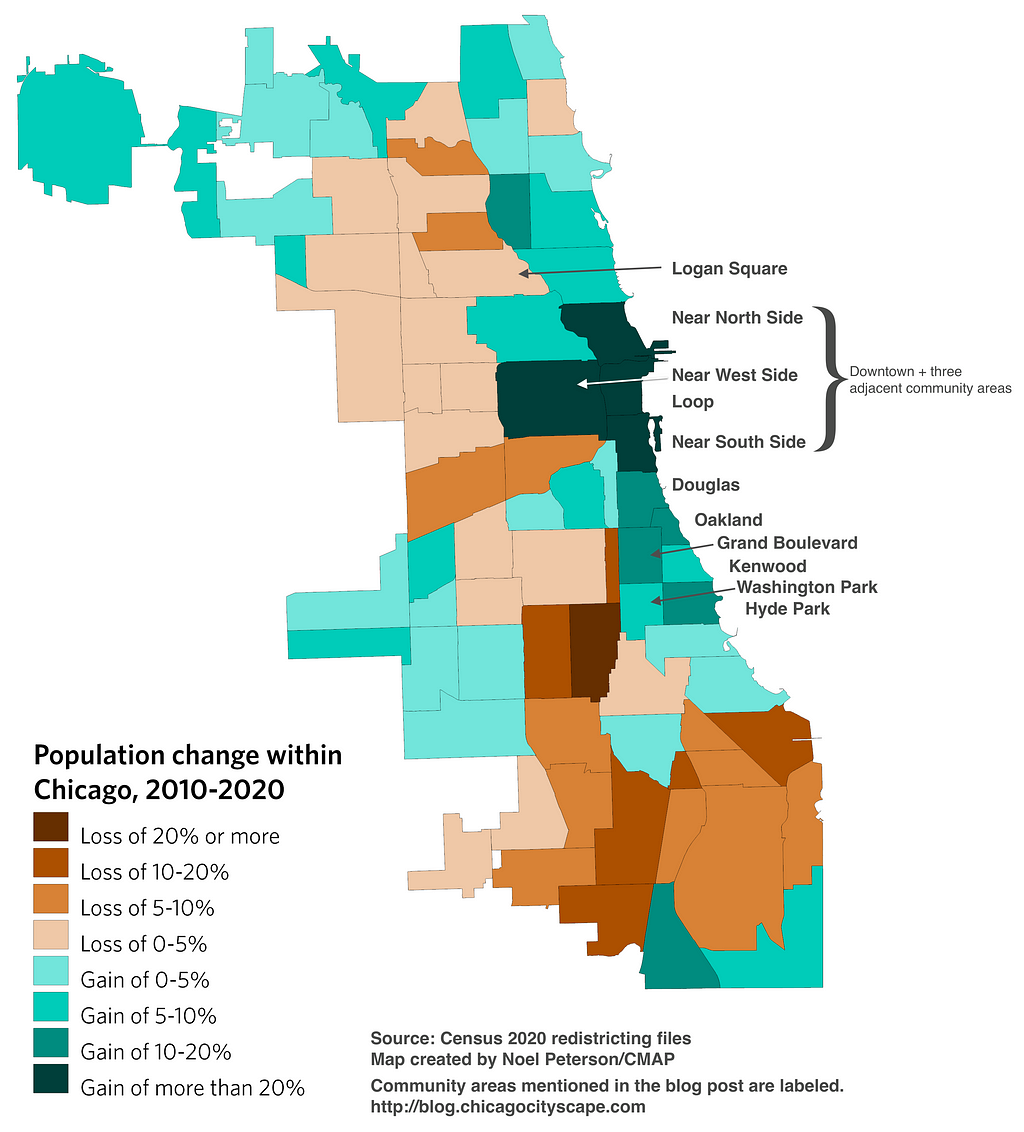
A more recent Crain’s article explores the growth in Bronzeville. The growth in those South Lakefront community areas can be seen in Noel Peterson’s map (who works for CMAP, and has posted the Census population data breakdown by community area).
The total increase in population in Douglas, Grand Boulevard, and Oakland was 5,594 people in 3,339 additional households (a population increase of 12.1 percent).
The growth in these three community areas underscores where a regrowth of the Black population in Chicago is happening, despite a 9.7 percent drop in the citywide Black population. Bread Price Fixer wrote, “An increase in Black residents accounted for a majority of overall population growth in Oakland, Grand Boulevard and Washington Park, and only Woodlawn saw a decrease in absolute number of Black residents.”
The Kenwood community area is also part of some people’s definition of Bronzeville, and the population increase there was 7.2 percent (or 1,275 people). Washington Park, which borders Hyde Park on the west, saw a greater increase than Kenwood of 8.5 percent (but a lower absolute change in population, with only 990 additional people).
The map, fascinatingly, shows that Logan Square lost population. It was already known for a while that the Hispanic/Latino population has decreased: “From 2010 to 2018 Logan Square’s Hispanic population fell from nearly 38,000 to just over 30,000 people — a loss of about 20%.” (Chicago Sun-Times, December 2019).
In fact, the total population of Logan Square decreased 1.5 percent from 2010 to 2020. At the same time, the White population increased there by 11.6 percent. The household size decreased 9.7 percent while the number of households increased 9.4 percent. Finally, the number of dwelling units increased by 6.9 percent.
I was glad to see that the number of dwelling units increased because Logan Square has been a prime area for deconversions (converting 2 or 3 units into 1) and teardowns (replacing 2 or 3 units with a new single-detached house). What we don’t know yet — from the Census data already made available — is how the affordability of existing units has changed and changes in households’ incomes and composition (number of children, elderly, etc.)
What data is coming later?
The Census Bureau will continue processing the census data and publish tables about age and sex, and the combinations of race and ethnicity and age and sex data. The other information that we commonly ascribe to the Census — including educational attainment, income, housing type and costs (including mortgage and rent), veteran status — will be part of the U.S. Census Bureau’s American Community Survey (ACS) 2020 release in December.
You can use our Lending & Investment Snapshot (which is an accessory to Place Snapshot and Address Snapshot) to review pre-2020 Census information in those above-mentioned categories.
Where can I get the data?
Download the full or processed datasets using the links below. Or, look up the Place Snapshot for any of Chicago’s 77 community areas on ChicagoCityscape.com and review the data table in the “More info” section.
- Download the full 2020 Census’s “redistricting file” (via Census Bureau)
- Download the processed population, household, and dwelling units data by Chicago community area (via CMAP)
- Download the processed data by Chicagoland municipality (via CMAP)
What does the 2020 Census data tell us about Chicago and Chicagoans? was originally published in Chicago Cityscape on Medium, where people are continuing the conversation by highlighting and responding to this story.
Other posts by Steven Vance full archive